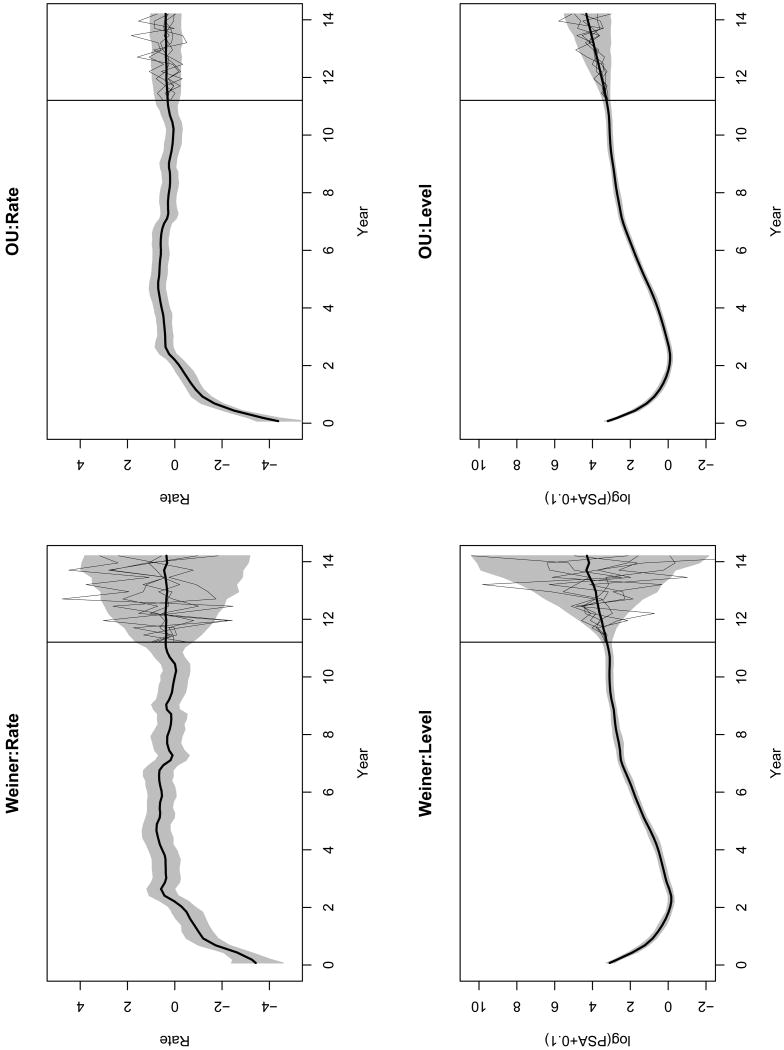
Figure 2.
PSA posterior summary and forecasting: Plots of posterior means(—) and 95% credible intervals(gray shades) for the SVM with the Wiener process and OU process, respectively, till year 11.2. The future rates and levels are forecasted for the next 3 years, illustrated by the forecasting means (—) and 95% forecasting credible intervals(gray shades). The 5 randomly picked realizations for each plot are also illustrated.

