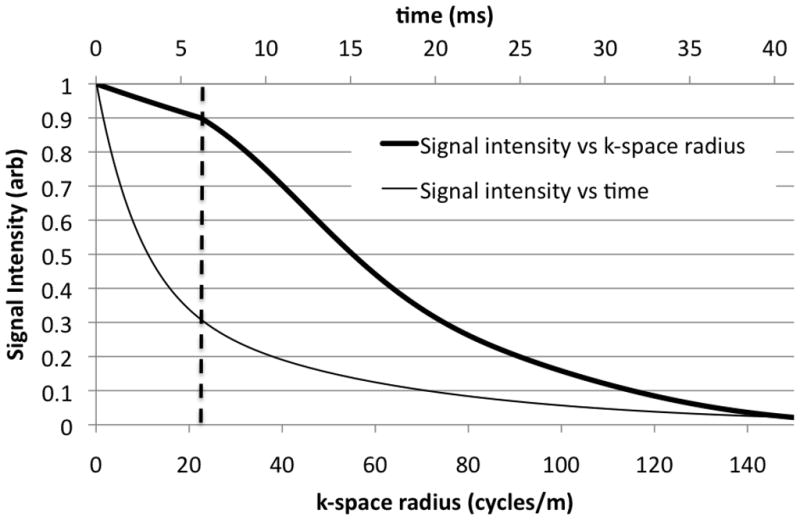
Figure 2.

Simulated signal intensity from a unit amplitude point source with a bi-exponential decay (60% T2=2.5 ms, 40% T2=14 ms) for a flexTPI acquisition (GMAX=5 mT/m, SMAX=200 mT/m/ms, FR=0.15, FOV=20 cm, NM=60). The thick line is the signal intensity as a function of k-space radius, which has a non-exponential form (relative to k-space radius). The thin line is the signal intensity as a function of time with the conventional exponential form and corresponds to the signal for a comparable radial acquisition. The vertical dashed line indicates the point at which flexTPI trajectories transition from radial to twisting.
