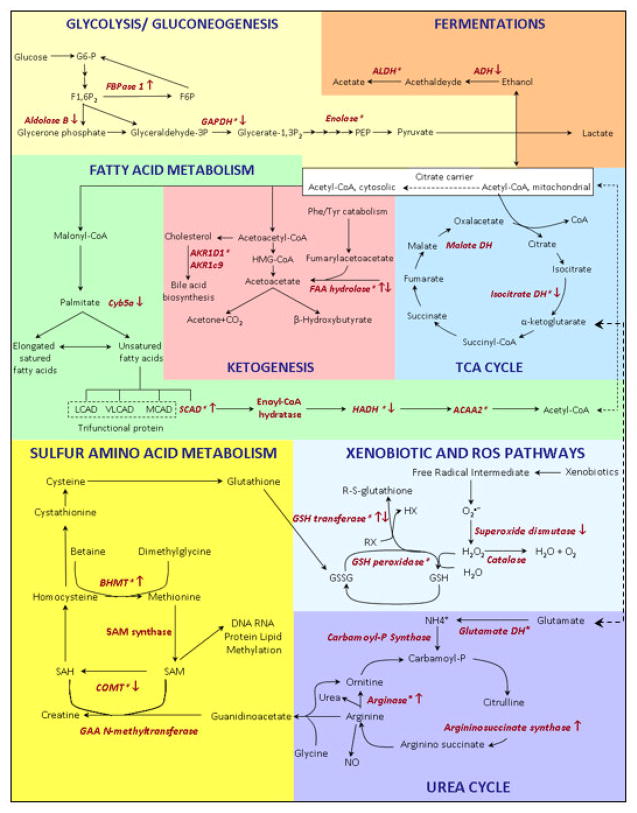
Figure 6.
Overview of the metabolic pathways of differentially expressed proteins (marked in red) following T3 treatment. The regulation level is indicated by the arrows. Asterisks indicate the detection of multiple isoforms for a given enzyme. For protein annotation and fold change, see Table 1.

