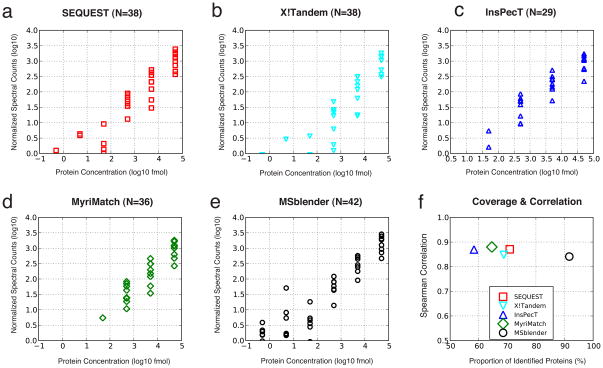
Figure 5.
Length normalized spectral counts against known protein concentrations in the UPS2 dataset (FDR 0.5%). Spectral counts and concentrations were rescaled to log10. a–e: Individual search engines and MSblender. The number in subtitle parentheses reports the number of proteins identified. Across all protein concentrations, normalized spectral counts increase in MSblender, showing that MSblender improves the dynamic range of spectral counts. f: Spearman rank correlation coefficients (RS) against percentage of proteins identified, defined as the number of identified proteins divided by the total number of proteins known to exist (48). MSblender improves the protein identification substantially (x-axis), while maintaining a correlation between observed and known protein concentrations similar to single search engine results.

