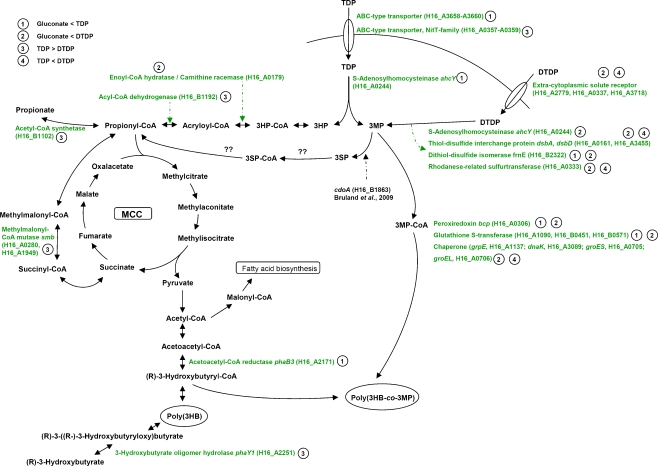
Fig. 5.
Overview of the genes putatively involved in the catabolism of TDP and DTDP. The ratio Cy5 (sample)/Cy3 (common reference) was calculated and was taken to represent the relative RNA abundance. The extent of the gene expression levels between samples provided a measure of the overall gene expression pattern between samples. (1) Genes were detected as upregulated during cultivation with TDP in comparison to gluconate. (2) Genes were detected as upregulated during cultivation with DTDP in comparison to gluconate. (3) Genes were detected as upregulated during cultivation with TDP in comparison to DTDP. (4) Genes were detected as upregulated during cultivation with DTDP in comparison to TDP. The complete lists of all studied genes are given in the Online Resources 1–4. MCC 2-methylcitric acid cycle

