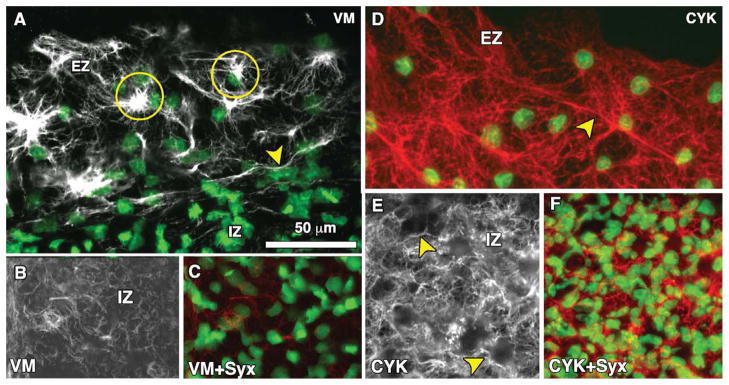
Fig. 3.
Representative high-magnification (60×) confocal images for vimentin (A–C) and cytokeratin (D–F) immunofluorescence at the edge zone (EZ) and inner zone (IZ) of Stage-4 quail blastoderm. A: Vimentin expression (grayscale) is shown merged with Sytox nuclear labeling (green) at the edge of the blastoderm. The arrowhead shows a thick vimentin filament running circumferentially (parallel to the direction of the edge) that appears to delineate the transition between the EZ and IZ. Also shown are dense vimentin clusters or foci, which typically appear to be closely associated with edge cell nuclei (circles). B,C: Vimentin expression is shown in the IZ alone (B) and merged with Sytox nuclear labeling (C). In the IZ region, vimentin appears primarily as “squiggles” (circle). Also note the absence of the dense vimentin foci found in the EZ. See Supplemental movies S1 and S2 for high-resolution confocal z-stacks of vimentin immunofluorescence at the EZ and IZ. D: Cytokeratin at the EZ (red) is shown merged with Sytox nuclear labeling (green). The arrowhead indicates a prominent cytokeratin fibril. Note the highly interconnected “web-like” network visible throughout the EZ. E,F: Cytokeratin expression in the IZ. Arrowheads denote appearance of fibrils. Scale bar in A is the same for all panels.

