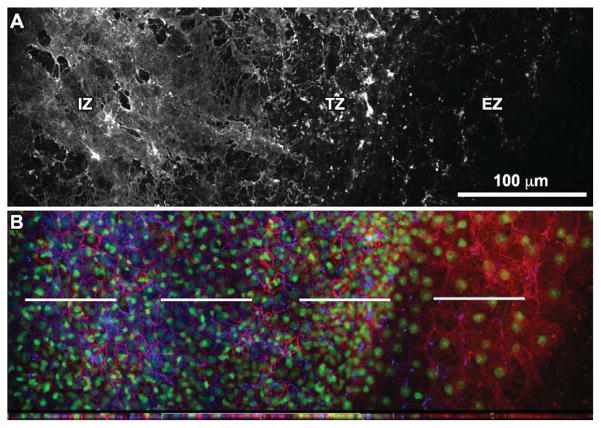
Fig. 5.
Laminin expression at the edge of the quail blastoderm. A: High-magnification (60×) confocal panoramic representation of laminin immunofluorescence reveals an edge zone (EZ), transition zone (TZ), and inner zone (IZ) of progressively increasing expression. The image is composed of four overlapping high-resolution 60× images to create a montage effect. B: For the same region, β-catenin (red) and nuclear (Sytox Green) staining is shown together with laminin (blue). Below the merged image is a cross-section taken at the level of the dashed white lines. Confocal z-stacks for each of the three regions are included in Supplemental Movies S5–S7.

