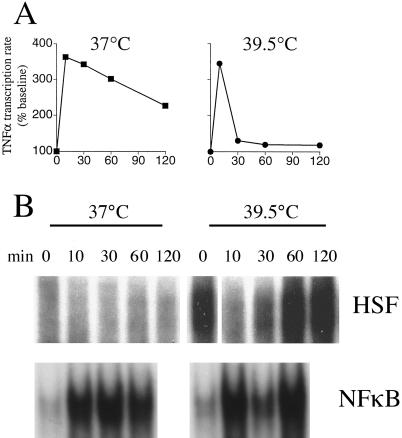
Fig 2.
Effect of incubation temperature on TNFα transcription and HSF-1 and NFκB activation. (A) TNFα transcription in Raw 264.7 cells. Cells were preincubated for 30 minutes and then stimulated with 100 ng/ml LPS at the indicated temperature and the TNFα and glyceraldehyde phosphate dehydrogenase (GAPDH) transcription rates were measured by nuclear run-on assay. Background signal (insertless plasmid) was subtracted, and the TNFα/GAPDH ratio was calculated for each time point and normalized to pre-LPS levels at each temperature. Mean ± SE; *P < 0.05 compared with 37°C. (B) An electrophoretic mobility shift assay (EMSA) analysis of HSF and NFκB. EMSA was performed using an HRE sequence probe from the human Hsp70 promoter (5′-GATCTCGGCTGGAATATTCCCGACCTGGCAGCCGA-3′) (upper) or an NFκB response element probe from the murine TNFα promoter (5′-ACAGGGGGCTTTCCCTCCT-3′). Raw 264.7 nuclear extracts were obtained after incubation with 100 ng/ml LPS at the indicated temperature and for the indicated time. For the 39.5°C extracts, cells were preincubated at 39.5°C for 30 minutes prior to adding LPS

