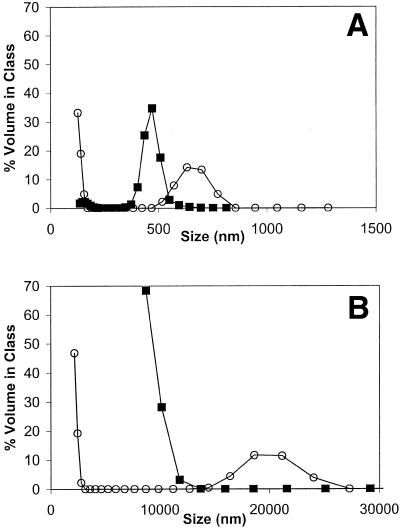
Figure 7.
Comparison of particle size distributions for lipoplexes and liposomes. Lipoplexes (A) and liposomes (B) were prepared in final vehicles of PBS (squares) or 150 mM sodium phosphate (circles) pH 7.2 with GAP-DMRIE:DOPE (1:1) at a 0.25 cytofectin/pDNA molar ratio. Note the difference in the x-axis scale between (A) and (B).

