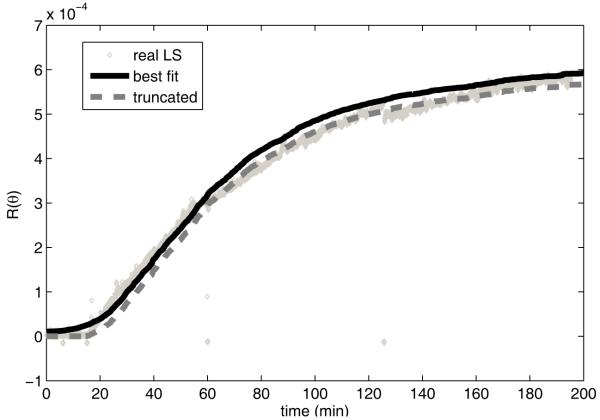
Figure 5.
Simulated and real light scattering data for HPV LP1 assembly at 145 μg ml−1 using optimized rate parameters. The solid curve shows the best-fit simulation trajectory. The dashed curve shows the result of reducing the best-fit values by 2.5×10⁻⁵ and truncating negative values to zero to simulate insensitivity of the detection apparatus to low values in the measurements. The diamonds show the real light scattering data of Casini et al. [30].

