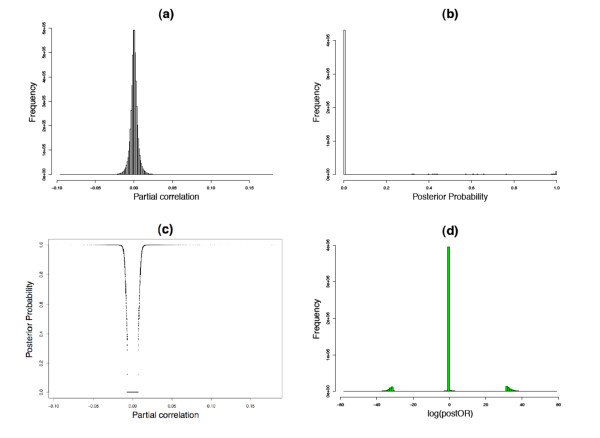
Figure 2.
An example of partial correlations, posterior probabilities and log odds ratios. (a)Histogram of partial correlation. (b)Histogram of posterior probabilities. (c) The distribution of partial correlations and their corresponding posterior probabilities. (d)Histograms of log odds ratios. Data generated using Illumina HumanRef8 expression data from peripheral blood CD4+ lymphocytes [25].

