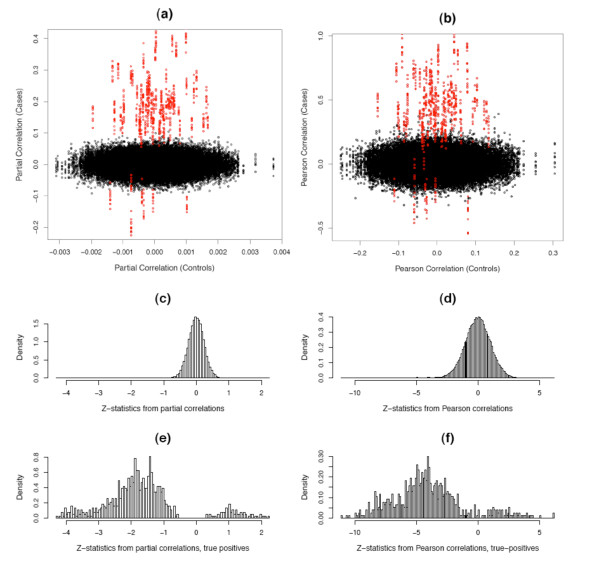
Figure 5.
Partial correlations and Pearson correlations. Panel (a-b) show the distribution of Fisher-transformed partial correlation (a) and Pearson correlation coefficients (b) from the simulated "case" and "control" data sets. The red dots represents the differentially connected edges. Panel (c-f) show the histograms of z-statistics  , where zijc and zijd are the Fisher-transformed correlation coefficients from the "case" and "control" data sets, respectively. Panel (c-d) are for all edges and panel (e-f) are for the truly differentially connected edges only.

