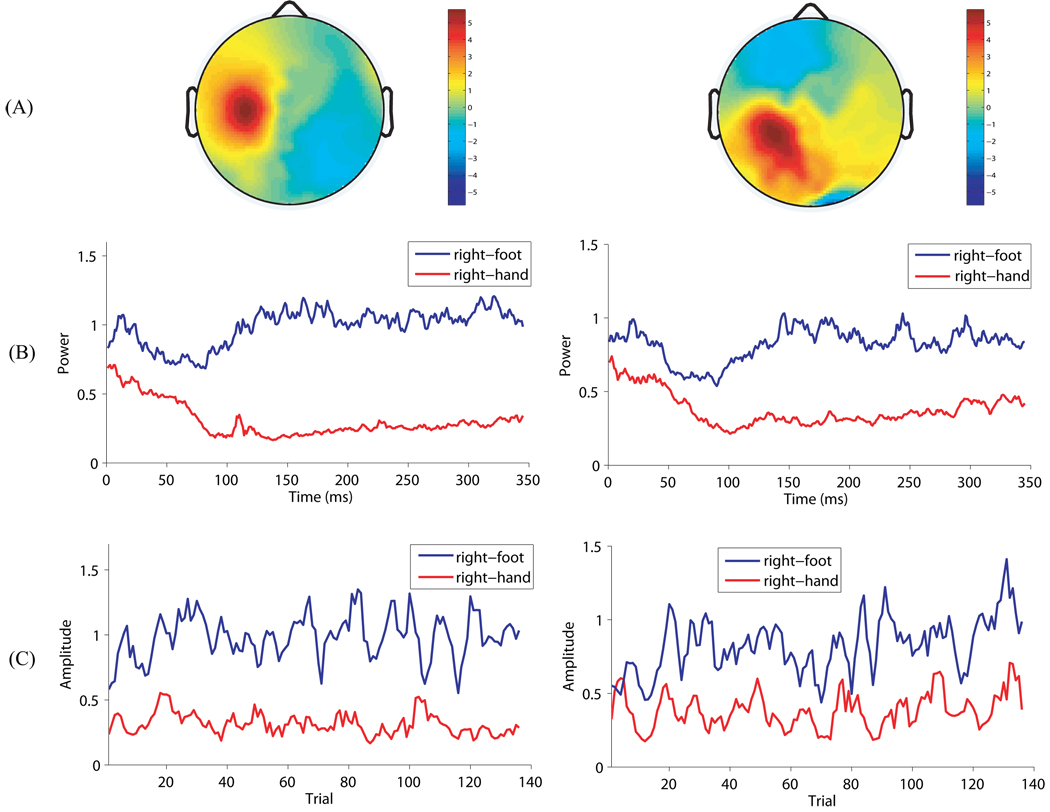
Figure 12.
The spatio-temporal patterns of the two most discriminative source signal estimated by VB for subject ay. The left column is for the most discriminative source signal, and the right column is for the second most discriminative source signal. (A) The spatial pattern on the scalp. (B) The change of instantaneous power across time for both conditions. Both curves are obtained by averaging over the associated test trials. (C) The evolution of trial amplitude for both conditions. The amplitude at each trial is smoothed by taking its average within the subsequent 3 trials. Note that the trial order on the horizontal axis may not be important in the interpretation of the results since the trials may have been randomized in order in the BCI competition data set.

