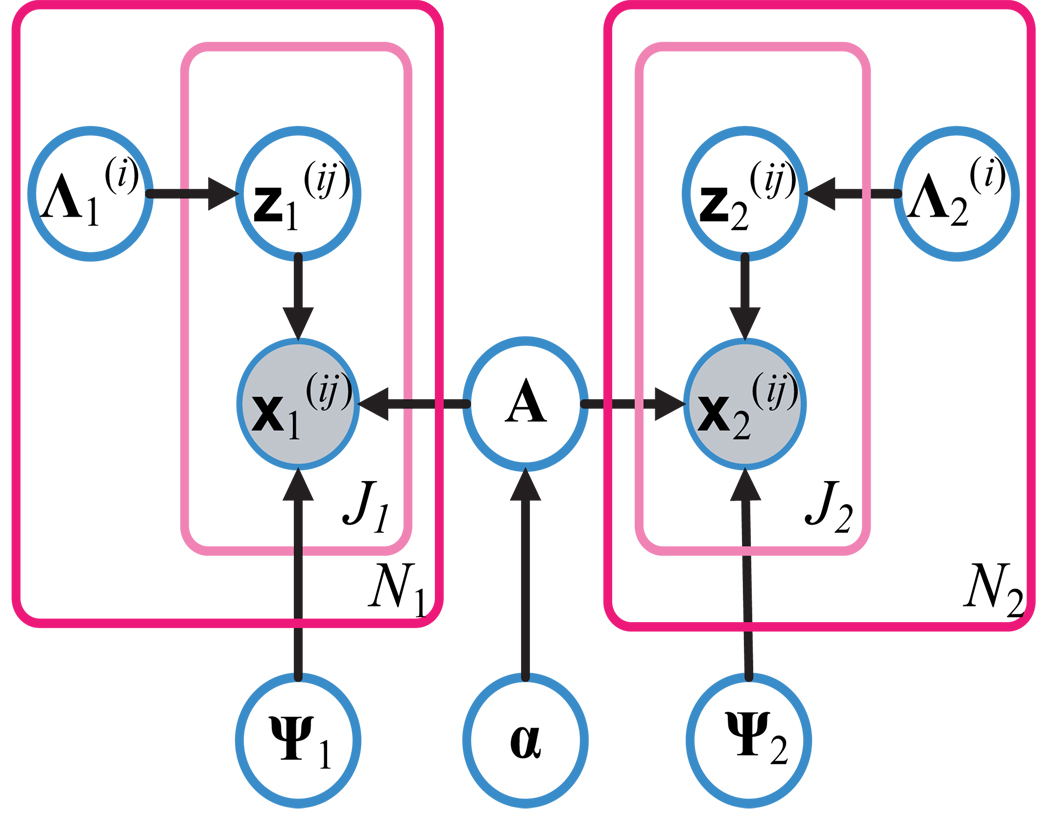
Figure 2.
A graphical model representation of the hierarchical model (1), with arrows indicating statistical dependencies. The outer plate represents the multiple-trial data set with Nk trials for condition k (k = 1, 2), where the trial index is given by i; the inner plate represents single-trial data within the data set with Jk observations for condition k, and the observation index is given by j.

