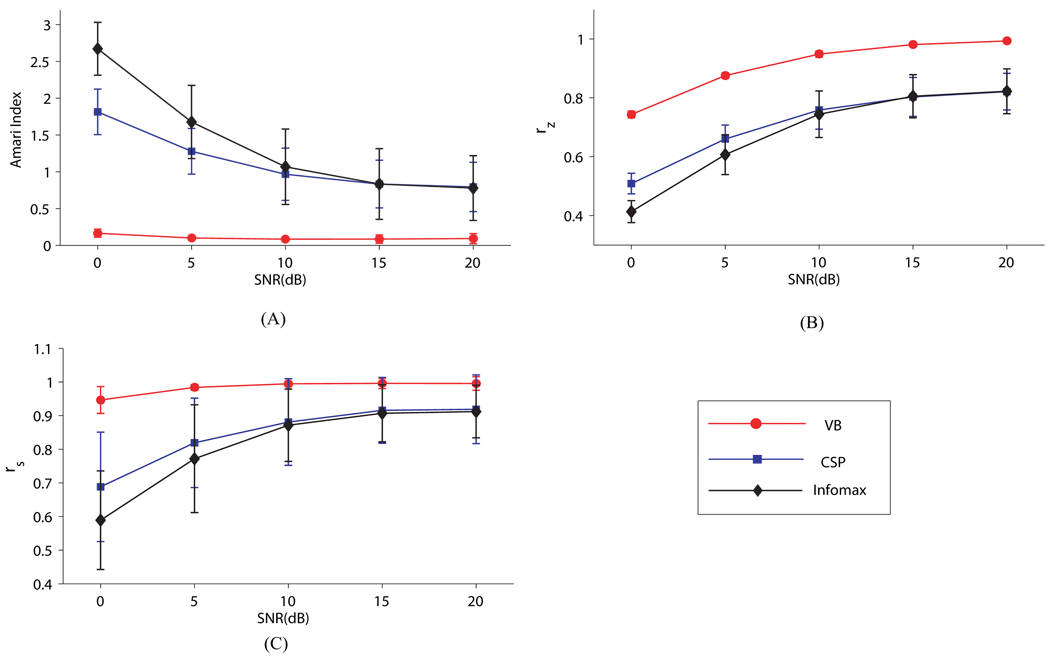
Figure 6.
Comparison between the results of the VB, CSP, and Infomax algorithms at different SNR settings. Each result is obtained by averaging over 50 Monte Carlo runs. (A) The Amari indices between the estimated mixing matrix and the true one. (B) The correlation coefficients between the estimated source signals and the true ones. (C) The correlation coefficients between the trial amplitude of the estimated source signals and that of the true ones.

