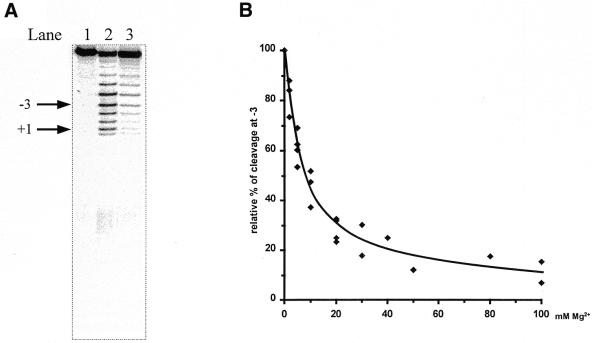
Figure 5.
(A) Lead(II)-induced cleavage of 3′-labeled pATSerCGSyn in the absence and presence of Pb(OAc)2, as indicated. The arrows indicate the fragment (–3) used to calculate the apparent Ki values given in Table 1 and the RNase P cleavage site at position +1. The sizes of the fragments were determined by parallel runs of pATSerCGSyn cleaved with M1 RNA, which cleaves this substrate at the +1 position (see also 11). Pb2+ cleavage was performed at 37°C for 6 min as described in Materials and Methods. Lane 1, no Pb(OAc)2 added; lane 2, 2 mM (final concentration) of Pb(OAc)2 added (no other divalent metal ion added); lane 3, 2 mM Pb(OAc)2 and 50 mM MgCl2 (final concentrations) added. (B) Relative percentage of Pb2+ cleavage plotted as a function of increasing concentration of MgCl2 using fragment –3, as indicated in (A). The apparent Ki value was determined as the concentration of MgCl2 resulting in 50% inhibition. The apparent Ki values are summarized in Table 1.

