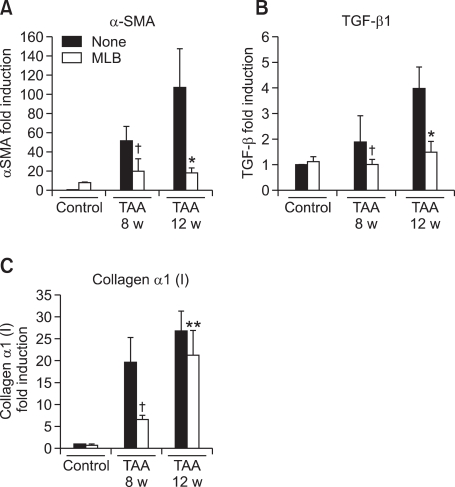
Figure 4.
Hepatic mRNA expression of fibrosis-related genes in TAA-treated rats. (A) α-SMA, (B) TGF-β1, (C) collagen α1(I) mRNA levels in rat livers were quantified by quantitative RT-PCR using Taqman probe after reverse transcription. The mRNA expression of these molecules was normalized with rat PBGD expression. Data represent the mean ± SD of two independent experiments. †P < 0.01 compared with TAA-8 week, *P < 0.01 compared with TAA-12 week, **P < 0.05 compared with TAA 12-week.

