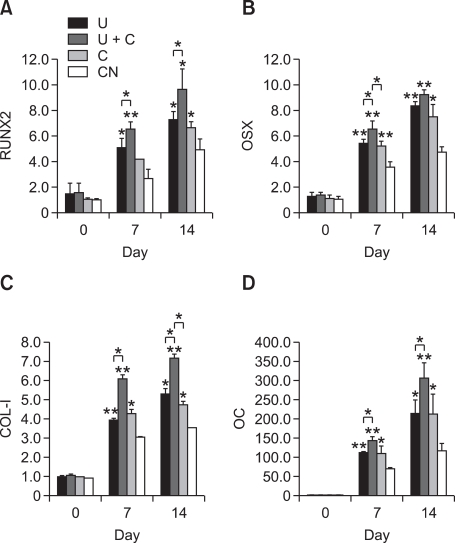
Figure 4.
The levels of gene expression measured at day 0, 7, and 14 using real-time PCR. (A) RUNX2; (B) OSX; (C) COL-I; (D) OC. Single asterisks (*) denote statistically significant differences relative to the control at P < 0.05; double asterisks (**) indicate statistically significant differences relative to the control at P < 0.01.

