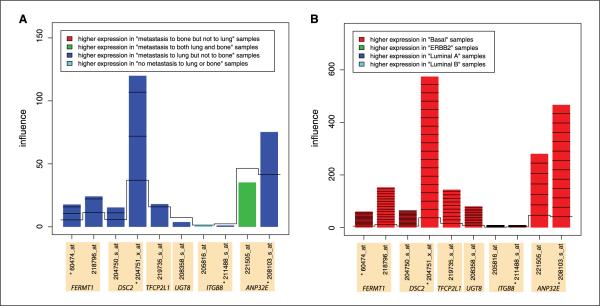
Figure 2.
Results of globaltest analysis, which tested the association between gene expression profiles and (A) metastasis status and (B) molecular subtype in the MSK data set (8). The bar height indicates the influence of the respective gene on the test statistic. Note that A and B are very different scales. The color shows in which of the phenotype group the gene has higher expression values. *, four probe sets that intersect with the Landemaine six probe sets.

