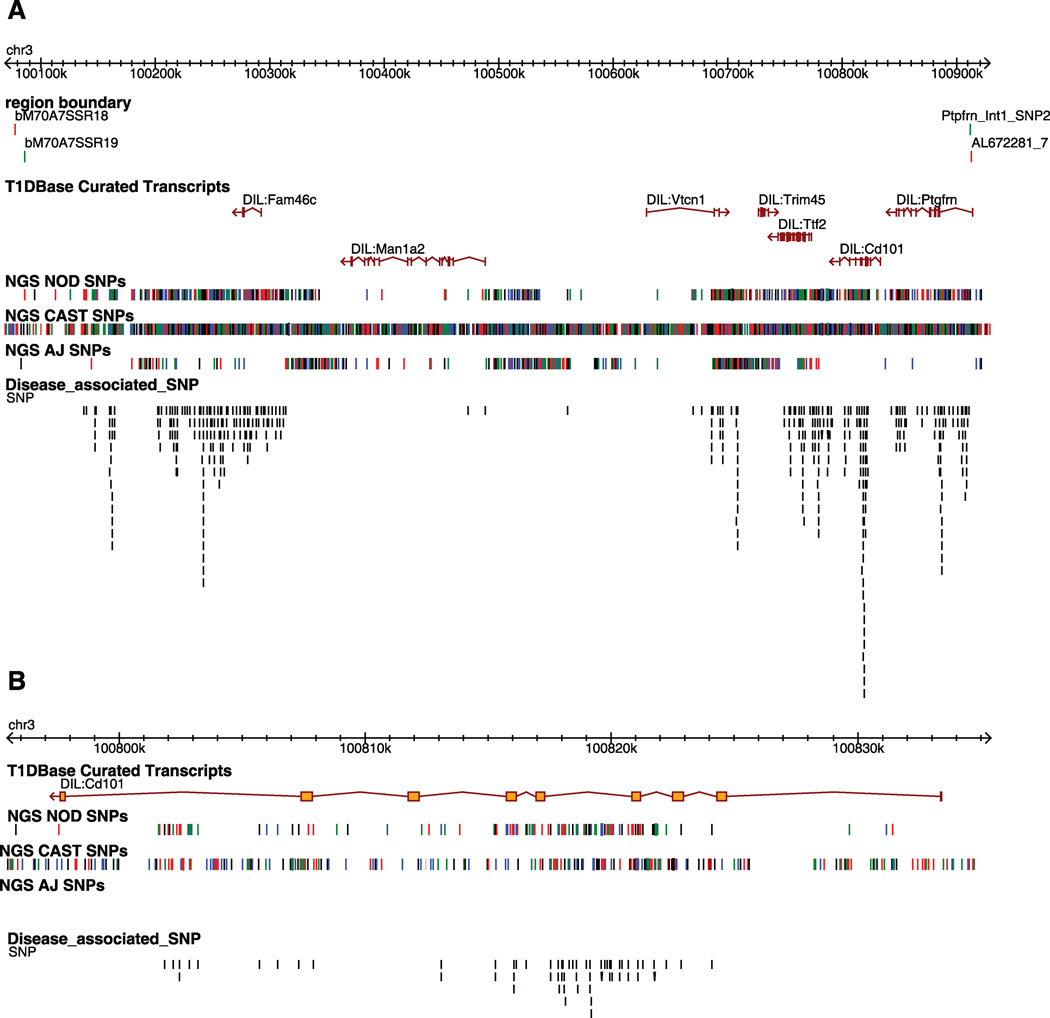
Figure 1. Gene content and allelic variants in the Idd10 region on mouse chromosome 3.
A, The in and out boundaries of the Idd10 region are represented as green and red lines, respectively. The T1Dbase curated transcripts track displays the gene content of the Idd10 region. The NGS NOD, NGS CAST and NGS A/J SNP tracks represent the location of sequence polymorphisms relative to B6 identified from Next Generation Sequencing (NGS) performed at the WTSI; black, red, blue, and green lines represent the G, T, C, and A nucleotides, respectively. Where no SNPs are present, the sequence is identical to B6. Note that where multiple SNPs are located close together the lines in the SNPs track may represent more than one SNP. The disease-associated SNP track compares the SNPs present in NOD.B6 Idd10 and NOD.A/J Idd10 mice, which are T1D-resistant, and the NOD and NOD.CAST Idd10 strains that are relatively T1D-susceptible; a black line indicates the position at which one allele of a SNP is shared by the susceptibility haplotypes (NOD and CAST) and the other allele of the SNP is shared by the protective haplotypes (B6 and A/J). Disease associated SNPs are shown vertically in an ‘expanded view’ in order to distinguish SNPs that are close together. B, Zoomed in view of Cd101. The position of the SNPs in this figure is based on NCBI build 37.

