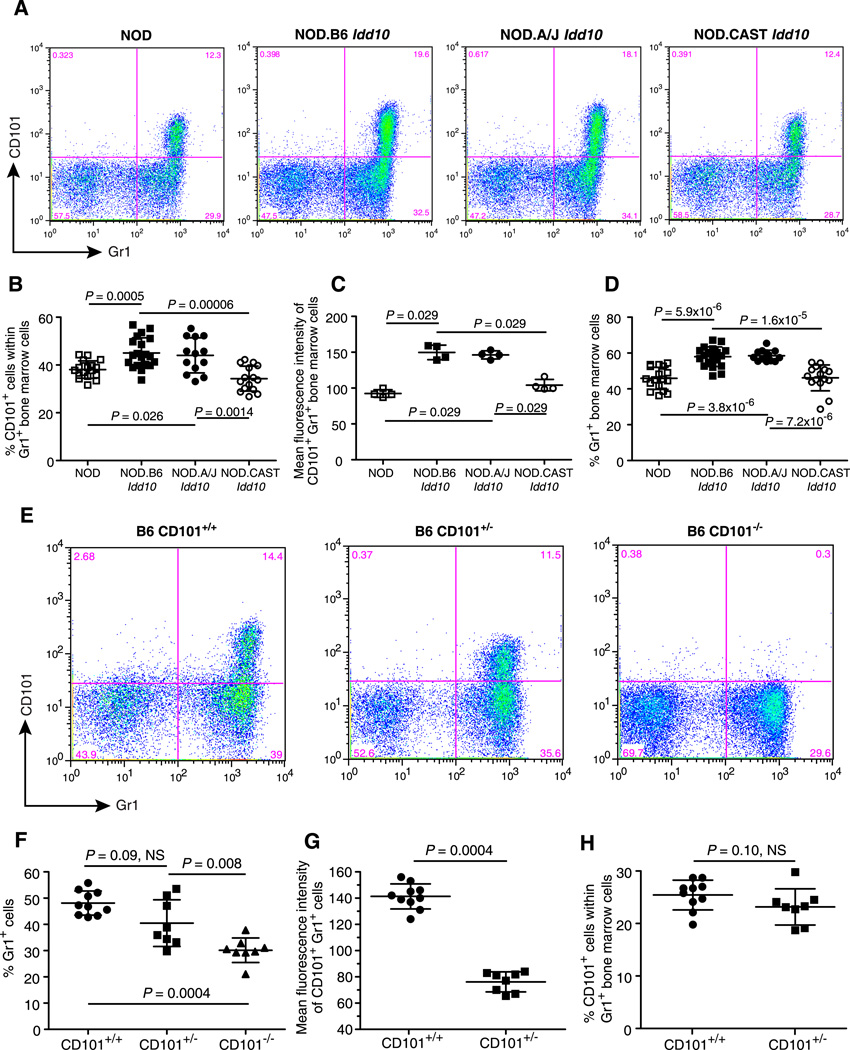
Figure 5. Cd101 genotype-dependent phenotypes in bone marrow cells.
A, Representative dot plots showing the expression of CD101 and Gr1 on bone marrow cells from NOD, NOD.B6 Idd10, NOD.A/J Idd10, and NOD.CAST Idd10 mice; gating strategy is shown in Supplemental figure 3A. B, Data for the percentage of CD101+ cells within the Gr1+ population are compiled from three independent experiments using groups of female mice 11–13 weeks of age. Each point represents an individual mouse (N = 17, 20, 13, and 15 for the NOD, NOD.B6 Idd10, NOD.A/J Idd10, and NOD.CAST Idd10 strains, respectively). C, The MFI of CD101+ Gr1+ cells for one representative experiment of three is shown. D, The percentage of Gr1+ cells in the non-erythroid light scatter gate was compiled from the same mice described in Fig. 5C. E, Representative examples of CD101 and Gr1 expression on bone marrow cells from wild type B6 mice (CD101+/+), B6 mice having one copy of the null allele of Cd101 (CD101+/−), and CD101 null B6 mice (CD101−/−). F, The percentage of Gr1+ cells in the non-erythroid light scatter gate was compiled from 3 independent experiments using groups of female mice 11–14 weeks of age. Each point represents an individual mouse; N = 10 for B6 (CD101+/+), N = 8 for mice expressing only one allele of Cd101 (CD101+/−) and N = 8 for CD101 null B6 mice (CD101−/−). G, The MFIs of CD101+ Gr1+ cells for the CD101+/+ and CD101+/− mice described in Fig. 5F are shown. H, The percentages of CD101+ cells within the Gr1+ population for the CD101+/+ and CD101+/− mice described in Fig. 5F are shown. Comparisons between groups were performed using the Mann-Whitney nonparametric test. Error bars indicate the standard deviation of the mean.

