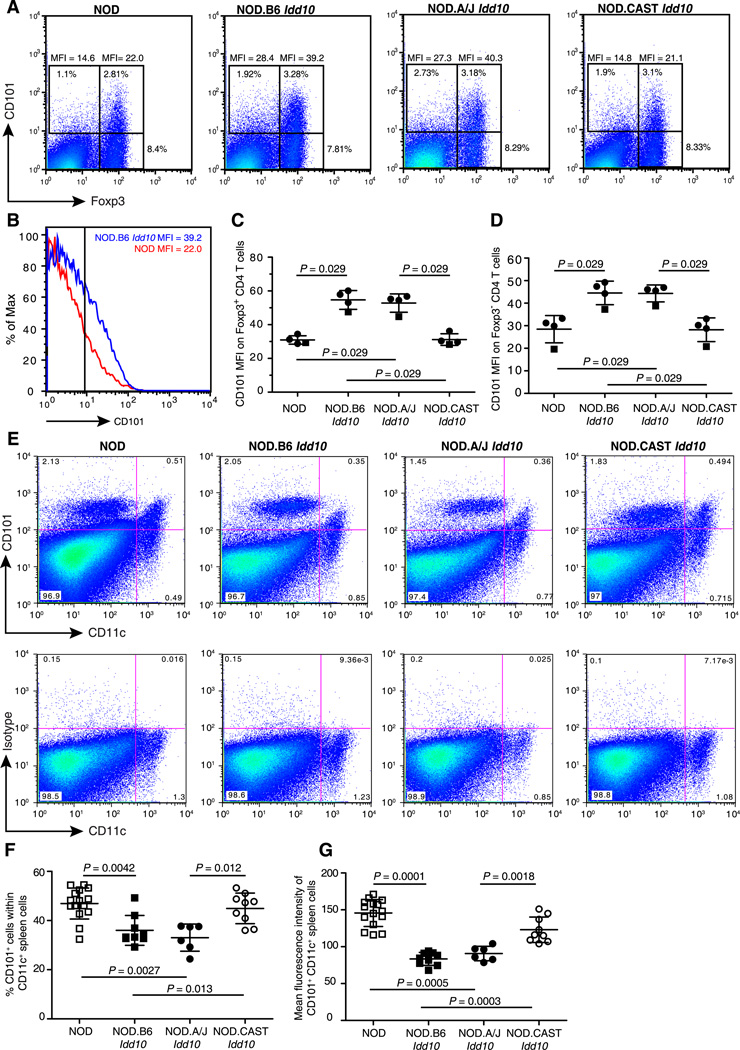
Figure 6. Cd101 genotype-dependent CD101 expression in spleen cells.
A, Splenocytes were gated on cells expressing the beta chain of the TCR and CD4 and assessed for CD101 and FoxP3 expression. Representative examples of the indicated congenic strains are shown. B, Representative examples of CD101 expression on FoxP3+ cells are shown for a NOD female (red histogram) and a NOD.B6 Idd10 female (blue histogram). Genotype-dependent expression of CD101 on FopP3+ CD4 T cells (C) and FoxP3− CD4 T cells (D) from 2 independent experiments are compiled; 3 mice from each strain were tested on one day (closed circles) and one mouse from each strain on a different day (closed squares). A third experiment showed the same genotype-dependent expression differences in both T cell subsets (not shown). Comparisons between groups were performed using the Mann-Whitney nonparametric test. E, Representative dot plots showing expression of CD101 and CD11c on spleen cells from NOD, NOD.B6 Idd10, NOD.A/J Idd10, and NOD.CAST Idd10 mice (top panel) and the isotype control (bottom panel). F, Data for the percentage of CD101+ cells within the CD11c+ population. Each point represents an individual mouse (N = 15, 9, 6, and 9 for the NOD, NOD.B6 Idd10, NOD.A/J Idd10, and NOD.CAST Idd10 strains, respectively). G, The MFI of CD101+ CD11c+ cells was compiled from the same mice described in F. Comparisons between groups were performed using the Mann-Whitney nonparametric test.

