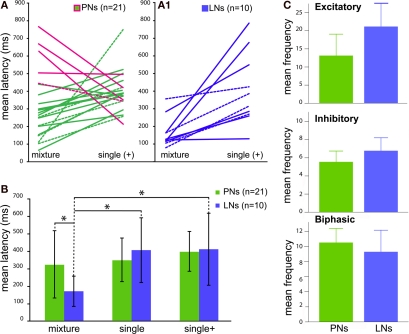
Figure 4.
Comparison of the response kinetics to blends vs. single components for individual antennal lobe neurons [both morphologically (dashed lines) and physiologically confirmed cells]. (A1) All local interneurons (LNs, blue) show significantly shorter latencies to the blend, whereas five [(A), magenta line] out of 16 projection neurons (PNs, green) depict shorter latencies to single components (LNs p = 0.0020, PNs p = 0.103). Single components were tested at the higher blend concentration (single+). (B) Average response latencies show differences between blend vs. single component latencies at the two different concentrations for LNs (blue) but not PNs (green). (C) Comparison of mean temporal patterns to blend stimuli between projection (PN) and interneuron (LN) responses (both morphologically confirmed and physiologically designated neurons). Traces represent PNs (green) and LNs (blue) respectively. Graphs are arranged as Excitatory, Inhibitory and Biphasic responses. Bar graphs depict total mean frequencies calculated from areas under the PSTH curves (not shown, compare Figure 5).

