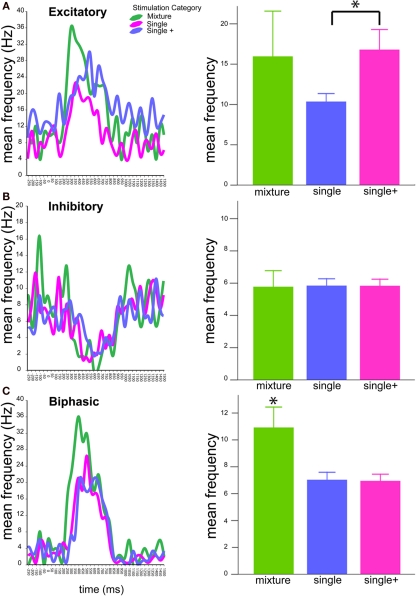
Figure 5.
Temporal patterns of antennal lobe neuron responses. Graphs at left depict PSTHs of mean response frequencies (Hz) to blends (green), single compounds (magenta), and single compounds tested at the mixture concentration (blue). PSTHs are presented as lines rather than bars to allow simultaneous comparison of stimulus responses. Graphs are arranged as (A) Excitatory, (B) Inhibitory, (C) Biphasic responses. Bar graphs (right) depict total mean frequencies calculated from areas under the PSTH curves after stimulus onset (0 ms). Asterisks indicate significant differences according to Student's t-tests. Bars ± SE.

