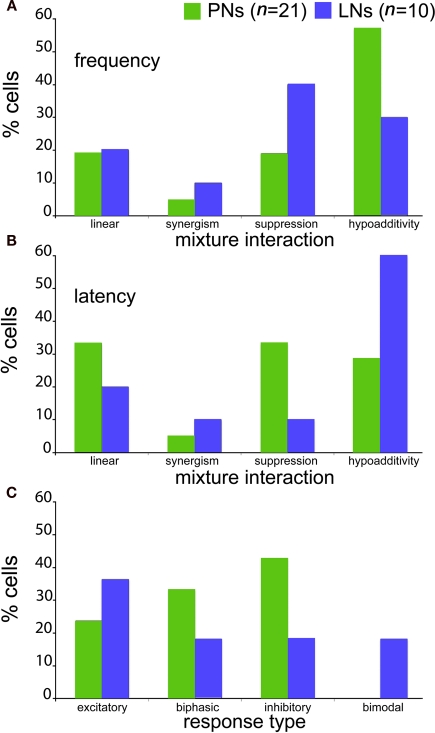
Figure A2.
Projection and local interneurons exhibit various blend interactions and response profiles but show no differences in response frequency or latency (both morphologically and physiologically confirmed cells). (A) Percentage of neurons exhibiting response frequency interactions to the blend. (B) Percentage of neurons exhibiting response latency interactions. (C) Percentage of neurons demonstrating various response profiles.

