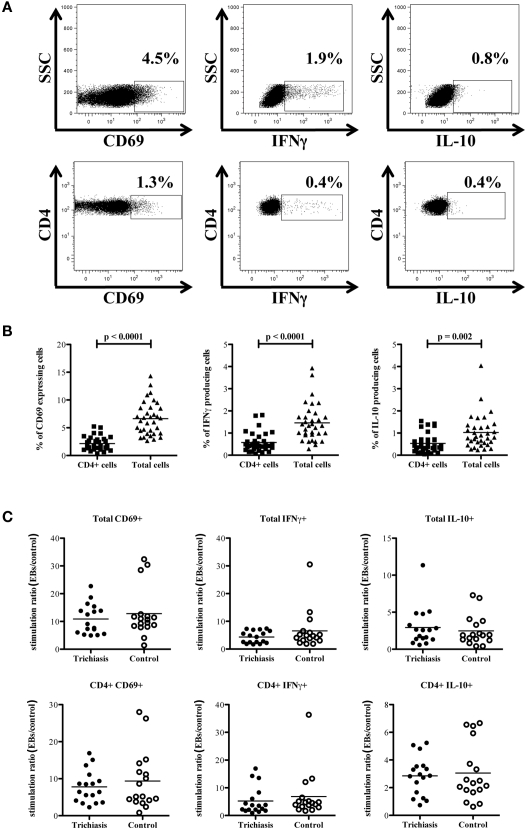
Figure 4.
CD4+ cells are not the primary source of IFNγ following stimulation with EBs. (A) Representative FACS plots of whole blood cultured for 48 h with EBs and co-stimulatory CD28/CD49d demonstrate the gating strategy used to distinguish between total and CD4+ IFNγ producing cells, as well as total and CD4+ IL-10 producing cells. (B) Percentage of total IFNγ+, CD69+, and IL-10 producing cells is significantly higher than the percentage of CD4+ IFNγ+, CD4+CD69+, and CD4+IL-10+ cells in all trichiasis cases and controls (n = 34), indicating that CD4+ T cells are not the only source of IFNγ, IL-10, and activated cells. (C) Responses from trichiasis cases (n = 17) and controls (n = 17) represented as a stimulation ratio (as in Figure 3). The ratio of CD4+ activated (CD69+) or IFNγ+/IL-10+ cells are slightly higher in the control group but the difference is not significantly different.

