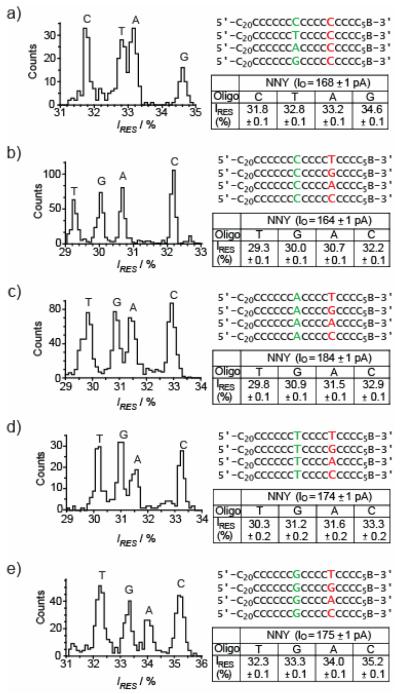
Figure 3. Four-base discrimination at R1 and R2, by an engineered αHL nanopore.
Histograms of residual current levels for E111N/K147N/M113Y (NNY) pores are shown (left), for a set of 4 oligonucleotides (right). B represents the 3′ biotin-TEG extension (Figure S1). Each experiment was conducted at least three times, and the results displayed in the figure are from a single experiment. When the oligonucleotides are driven into the αHL pore the substituted nucleotides are positioned at R1 (red) or R2 (green). Gaussian fits were performed for each peak in the histograms and the mean value of the residual current (IRES) for each oligonucleotide is displayed in the tables to the right of the histograms and in Tables S1-5 for panels a-e respectively.

