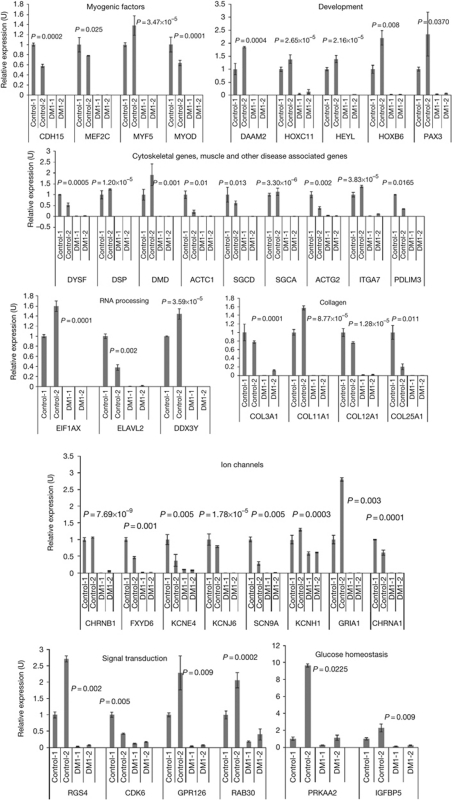
Figure 1.
Quantification of steady-state RNA levels in normal (control) and DM1 myoblasts. Synthesized complementary DNAs were subjected to real-time PCR analysis to measure the expression levels of RNAs in normal and DM1 myoblasts, with GAPDH RNA as an internal control. Error bars (±) represent standard deviation (n=3). P-values were determined by paired Student's t-test. DM1, myotonic dystrophy.

