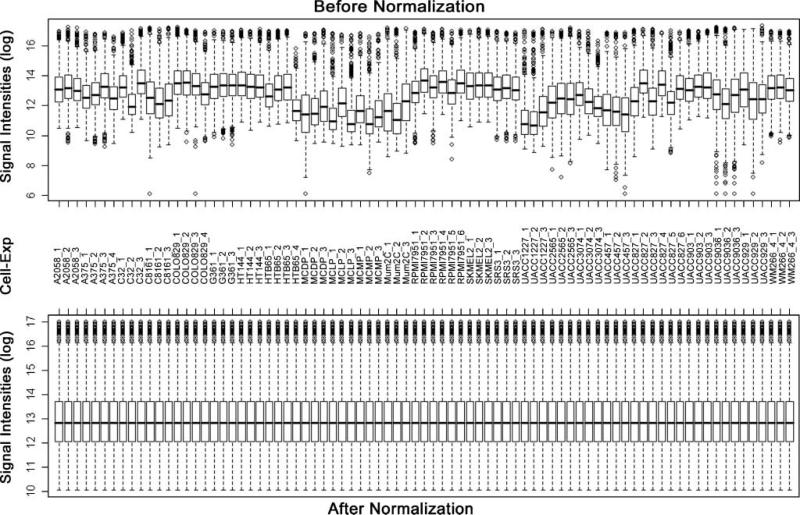
Figure 1.
Box plots of expression data before and after normalization. The quantile normalization algorithms were used to adjust the values of the background-subtracted mean pixel intensities of triplicate measurements per microarray for each and every set of 1,037 genes. Microarray experiments for most samples were conducted in triplicate, except for A375, COLO829, and HTB65 in four times and for RPMI7951 and UACC827 in six times. In contrast to the prenormalization box plots (top), the postnormalized box plots distribute in the same intervals with the same density center, indicating successful adjustment of data. The postnormalized data were used for further analysis. Cell, cell lines; Exp, independent microarray experiments; log, log2.

