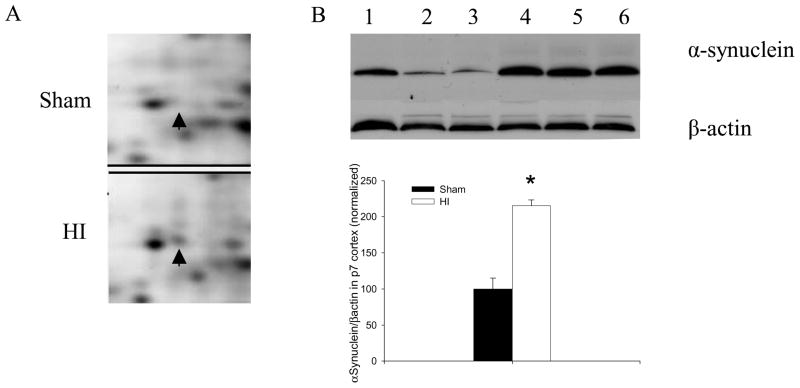
Figure 4.
Alpha Synuclein increased after HI. (A) Enlarged images of 2D protein profile representing increases in alpha Synuclein after HI. (B) Representative western blot assays and graphic representation of densitometry analyses of alpha Synuclein protein expression in cytoplasmic extracts of P7 rat cortices. Lane 1–3: Sham-treated; lane 4–6: HI-treated. β-actin was used as loading control. Values are mean ± SEM. N=7 in each group. *: p<0.05 compared to sham-treated group.

