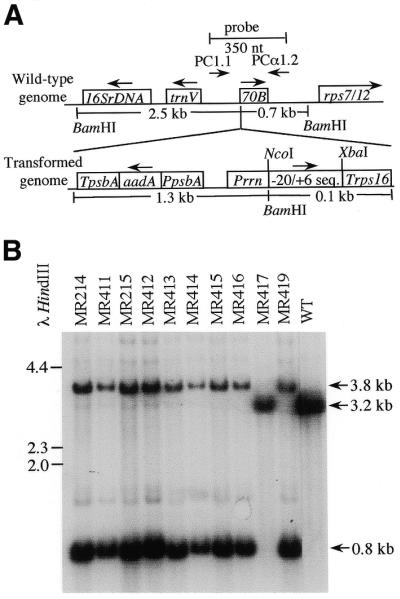
Figure 2.

Analysis of DNA from transplastomic tobacco plants. (A) Schematic representation of the wild-type plastid genome and the inserted sequences in the transformed genome. –20/+6 sequence represents the region in which potentially edited test sequences were cloned. See Figure 1 for exact nucleotide sequence. (B) DNA was isolated from leaves of transformed and control plants (WT) and digested with BamHI. DNA gel blots were probed with 350 nt of plastid genome sequence surrounding the plasmid integration site. Sizes of λ DNA digested with HindIII are indicated on the left, in kb.
