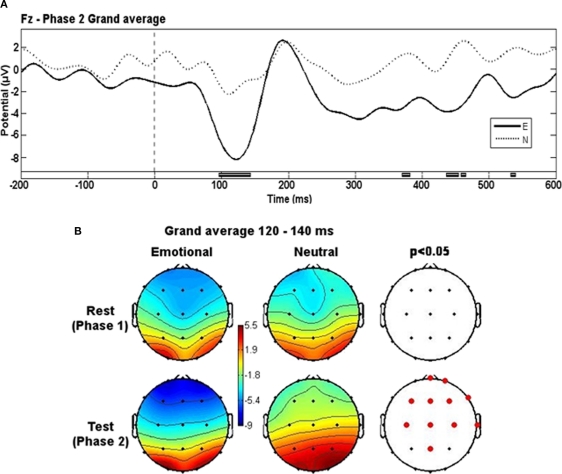
Figure 2.
Evoked potentials grand-averages. (A) Phase 2 grand-averages for E and N groups. Black blocks at bottom represent the time intervals where significant differences appeared. Low-pass filter of 20 Hz. (B) Topographical representation of activity for each group in both phases at the 120–140 ms time window. Red dots represent electrode locations where significant differences appeared.

