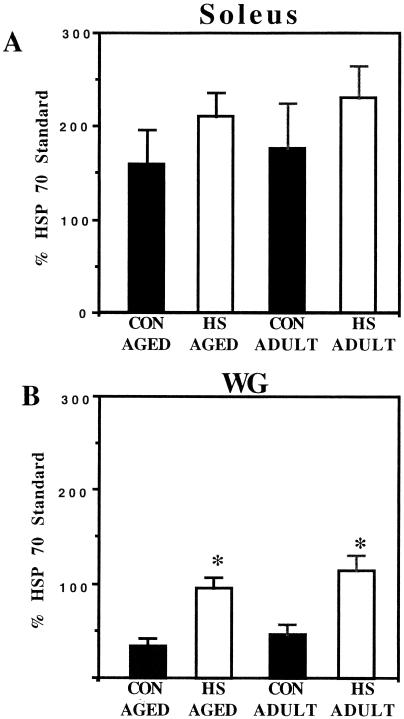
Fig 6.
Graphic representation of the densitometric scans from blots similar to those presented in Figure 5. Data are expressed as mean ± SEM. Statistical significance is indicated by an asterisk (n = 4 for all groups). (A) Soleus muscle. (B) White gastrocnemius muscle

