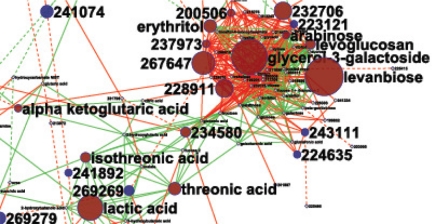
FIGURE 3.
Mapping metabolome regulation on biochemical networks. Shown is the regulation of the human ileal effluent metabolome after versus before ileostomy surgery (70), magnified for the carbohydrate cluster. Identified metabolites are mapped to the biochemical KEGG RPAIR Database and chemical similarity (green edges, dashed if <600 similarity), spanning a network displayed in Cytoscape. Unknown metabolites (BinBase Metabolome Database numbers (48)) are added by mass spectral similarity (red edges, dashed if <600 similarity). Red node metabolites are significantly increased in concentration (p < 0.05), blue nodes mark decreased compounds, and yellow nodes (small print) are not regulated. Node size indicates magnitude of change.

