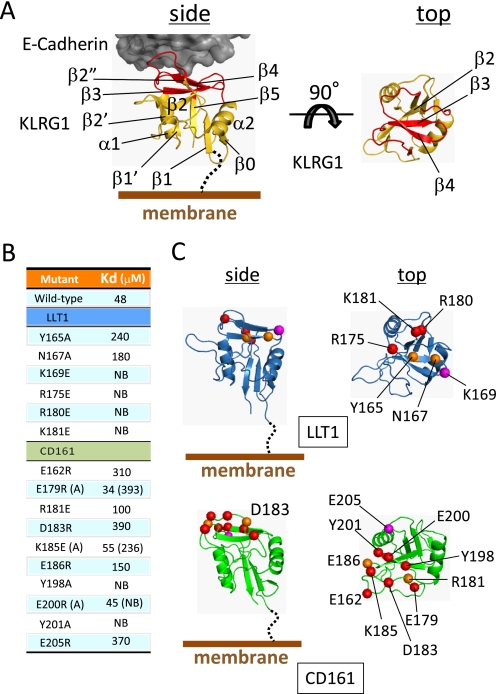
FIGURE 3.
Structure of E-cadherin-KLRG1 complex and mutagenesis studies. A, structure of the E-cadherin-KLRG1 complex structure. KLRG1 is depicted by a yellow ribbon diagram. Ligand binding region of KLRG1 is colored red. E-cadherin is shown as a dark gray surface representation. Two views of KLRG1 are presented (side and top views). Secondary structure elements are labeled. B, binding affinities of LLT1 mutants for immobilized CD161 mutants at 298.15 K. C, ribbon diagrams of model structures of LLT1 (top, blue) and CD161 (bottom, green). Each diagram shows side and top views. Residues mutated in this study are shown as spheres with detrimental effect in red and modest effect in orange. The magenta spheres indicate the pair of residues that showed detrimental effects when mutated independently but restored the binding when mutated simultaneously.

