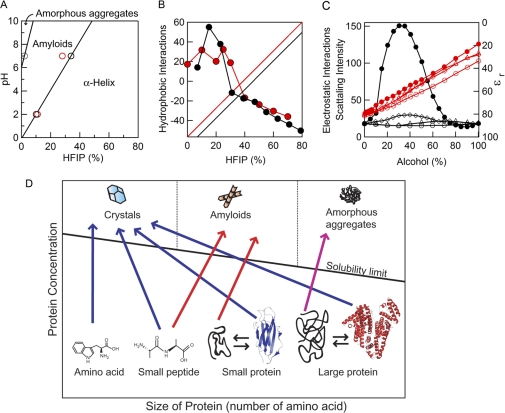
FIGURE 5.
Phase-diagrams of the formation of fibrils. A, phase diagram of the pH and HFIP concentration-dependent formation of hIAPP fibrils. The boundaries of the phases were determined from the midpoint of the HFIP-dependent conformational transition monitored using ThT (○) and CD (red circles). B, contribution of hydrophobic (circles, left axis) and polar plus charge (linear lines, right axis) interactions to the hIAPP fibrils under acidic (red) and neutral (black) conditions. Polar plus charge interactions were assumed to increase linearly with an increase in the HFIP concentration. Then the linear contribution was subtracted from the ThT intensities shown in Fig. 2 to make a similar pattern of hydrophobic contributions at acidic and neutral conditions. C, concentration-dependent clustering of alcohols monitored by small angle x-ray scattering (black symbols, left axis) and concentration-dependent decreases in the dielectric constant of alcohols (red symbols, right axis). Although the scattering intensity represents the strength of hydrophobic interactions, the dielectric constant represents that of electrostatic interactions. Methanol (○), ethanol (△), TFE (♢) and HFIP (●). Data are from Hong et al. (26) D, general phase diagram of the length- and concentration-dependent conformational transition of peptides and proteins. Native structures of the small and large proteins represent those of β2-microglobulin (PDB code 2D4F) and human serum albumin (PDB code 1AO6), respectively.

