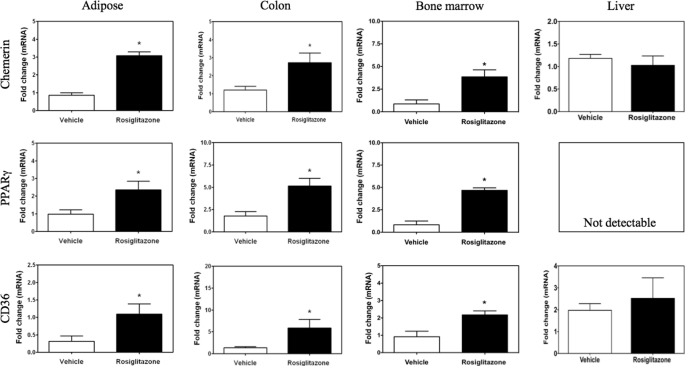
FIGURE 9.
Tissue-selective regulation of chemerin by rosiglitazone. Chemerin, PPARγ, and CD36 mRNA levels were measured by qPCR in the indicated tissues of C57BL/6J mice treated with daily injections of rosiglitazone (3 mg/kg, intraperitoneal) for 5 days. All values are expressed relative to the vehicle control and Error bars represent S.E. (n = 5). *, p < 0.05 compared with vehicle control.

