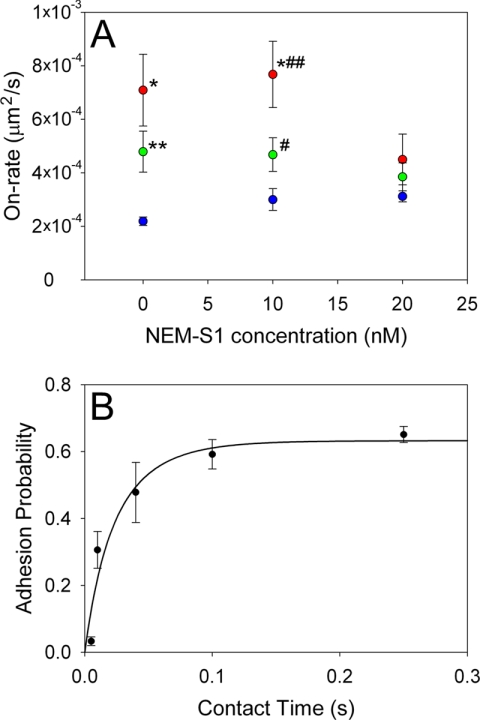
FIGURE 3.
The specific 2D on-rates of actin, A+Tm.P, and A+Tm.DP with HMM are plotted as function of NEM-S1 concentration to alter the state of Tm (A). Specific 2D on-rates (kon0) were calculated from Equation 3. The mean number of on-rate measurements per data point was 175. *, p = 0.0003 compared with actin beads. B, adhesion probability was plotted as a function of contact time for actin-coated beads making contact with HMM-coated pedestals. Adhesion probability was defined as the number of bonds formed divided by the total number of attempts. Equation 3 was fit (black line) to the data to determine the kon0. The mean number of steps per data point was 632. **, p = 0.0009 compared with actin beads; #, p = 0.02 compared with actin beads; ##, p = 0.03 compared with A+Tm.DP.

