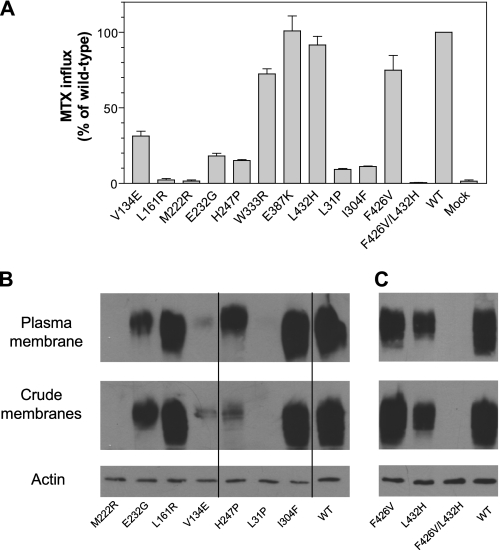
FIGURE 3.
Function and expression of PCFT point mutants. Panel A, analysis of function of PCFT mutants. Transport was measured as described in the legends of Figs. 1 and 2. Data are the mean ± S.E. from three independent experiments. Panels B and C, PCFT expression in both crude membrane preparations and accessible at the plasma membrane. Expression of actin served as the loading control for the crude membrane samples. The lines on the images indicate lanes that have been repositioned. The graphs shown in panels B and C represent different experiments; both are representative of two independent analyses. The relative PCFT levels at the plasma membrane were derived from quantifying band intensity and are the average of two independent analyses.

