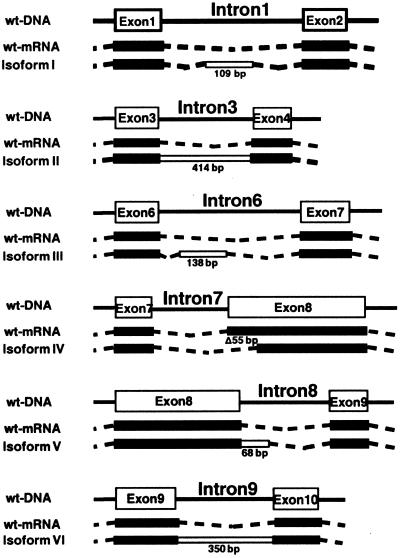
Figure 2.
Structural map of alternatively spliced XPG mRNA isoforms. To identify the isoforms, total RNA was reverse transcribed, RT–PCR amplified and subsequently subcloned into a cloning vector for sequencing (see Materials and Methods). The splice isoforms (I–VI, bottom) are compared to the wild-type XPG mRNA (middle) and the wild-type genomic XPG DNA (top). The genomic location and size (in base pairs) of insertions/deletions due to alternative splicing are indicated.

