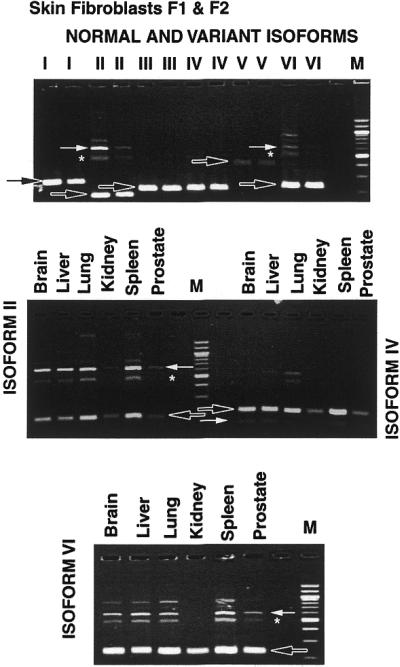
Figure 3.

XPG mRNA: normal and variant splice isoforms in human tissues. Top, cultured normal primary skin fibroblasts (F1-AG05247E and F2-AG05410). RNA was isolated from each cell line, cDNA was prepared by RT–PCR and amplified separately by use of primer pairs that cover both normal splice isoforms and each of the variant splice isoforms (I–VI). The PCR products were separated by agarose gel electrophoresis (see Materials and Methods). Each pair of lanes present results from F1 and F2, respectively, for each of the primer pairs. The black arrows indicate the location of the normally spliced isoforms. Detectable alternatively spliced isoforms are indicated by white arrows. The asterisk indicates a heterodimer of the normal and the abnormally spliced isoforms (II and VI). The normal isoform is present in each lane. Alternatively spliced isoforms II and VI are seen on the gel indicating their relative abundance. Middle and bottom, cDNA obtained from human brain, liver, lung, kidney, spleen and prostate tissue was amplified by use of primer pairs for XPG mRNA isoform II (middle, left), isoform IV (middle, right) and isoform VI (bottom) and separated by agarose gel electrophoresis. The black arrows indicate the normally spliced isoforms. The alternatively spliced isoforms (white arrows) and heterodimers between the normal and alternatively spliced forms (asterisk) are detectable in the different tissues. There appears to be a relative reduction in alternatively spliced isoforms II, IV and VI in the kidney compared to the other human organs.
