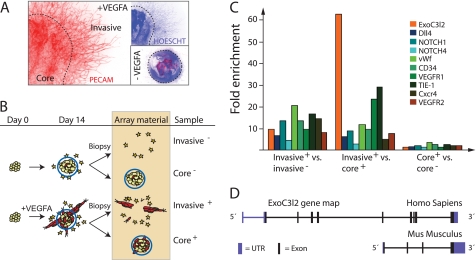
FIGURE 1.
Microarray analysis of differentiating EBs identifies genes that are highly expressed in invading vascular sprouts. A, the samples were collected from EBs after 14 days in culture. The core was separated from the invading cells as indicated by the dashed line. B, schematic drawing of a sample preparation for the microarray study. C, summary of the relative expression of a number of genes previously implicated in angiogenesis along with the expression pattern of exoc3l2. Invasive+ versus invasive− compares the sprouts and invading cells from the VEGFA-stimulated cultures to the invading cells of the unstimulated control. Invasive+ versus core+ compares the gene expression of the sprout fraction to that of the core fraction in VEGFA-stimulated cultures, and core+ versus core− compares the two core fractions (n = 3 for all samples). D, map of the exoc3l2 gene in human (chromosome 19, 9 exons, ENST00000252482) and mouse (chromosome 7, 4 exons, ENSMUSG00000011263). The mouse gene lacks the N-terminal equivalent of the human gene, but in the C-terminal region the similarity between the human and mouse sequences is around 85%.

