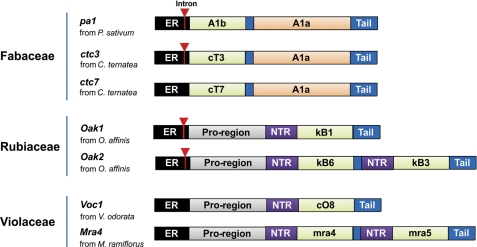
FIGURE 4.
Schematic comparison of the genetic arrangements of cyclotide (Rubiaceae and Violaceae), cliotide, and A1 (Fabaceae) genes (56, 57). Signal peptides are highlighted in black, N-terminal pro-domains are in gray, N-terminal repeats are in purple, A1b and cyclotide domains are in green, and A1a domains are in orange. The inverted triangles indicate the introns located in the signal peptide regions.

