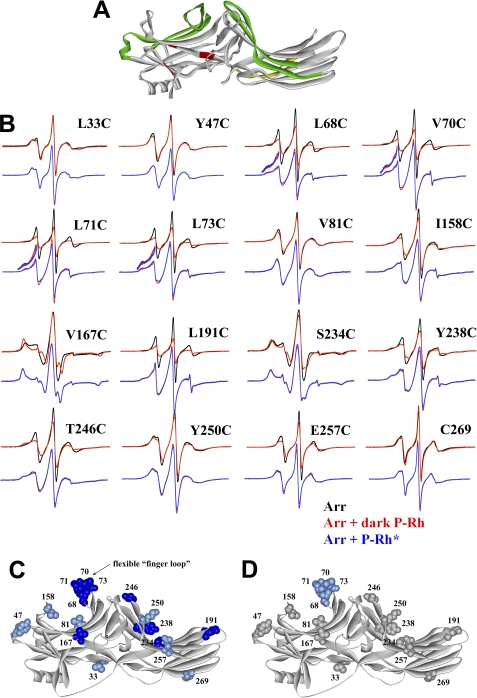
FIGURE 1.
Extensive receptor footprint on arrestin-2 identified by SDSL EPR spectroscopy. A, shown is the structure of arrestin-2 (6) with functionally important elements indicated as follows: phosphate binding residues (red); elements that determine receptor specificity (green); interdomain hinge (yellow) (image generated using ViewerPro 6.0). B, for each spin-labeled arrestin, normalized spectra in the absence (black) or presence of dark P-Rh (red) are compared in the top overlays, and spectra in the presence of dark P-Rh (red) and P-Rh* (blue) are compared in the bottom overlays. The lowfield portion of the bottom overlays for the finger loop spectra are magnified 2-fold in intensity to better illustrate the small changes in line shape. C and D, the magnitude of the detected changes in spin label mobility is color-coded on the arrestin-2 crystal structure as follows: gray, no change; light blue, small decrease in mobility; dark blue, large decrease in mobility. C, changes upon interaction with dark P-Rh are shown. D, additional changes induced by light activation of phosphorylated rhodopsin (P-Rh*) relative to those induced by binding to dark P-Rh are shown.

