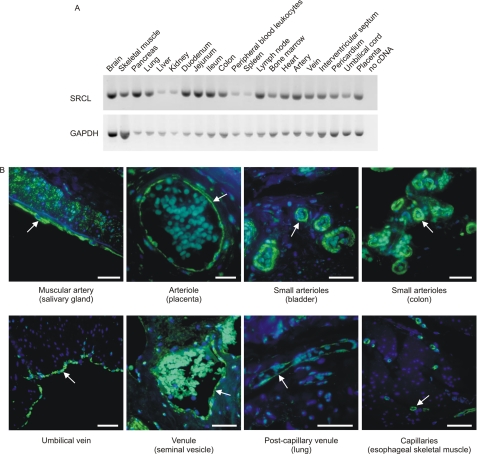
FIGURE 10.
Tissue distribution of SRCL expression. A, PCR analysis of the tissue distribution of SRCL. A fragment of 492 bases, covering the CRD-encoding region, was amplified for 35 cycles. Control amplification of the cDNA for glyceraldehyde-3-hydrogenase (GAPDH) for 25 cycles was performed in parallel. B, immunohistochemical localization of SRCL in tissues using rabbit polyclonal antibodies raised against the CRD of SRCL, counterstained with peroxidase-conjugated goat anti rabbit antibody, followed by tyramide treatment and incubation with Alexa 488-labeled streptavidin. Nuclei were visualized with DAPI stain. A summary of all tissues examined is provided in supplemental Table S11. Arrows highlight examples of endothelia, and bars indicate 50 μm.

