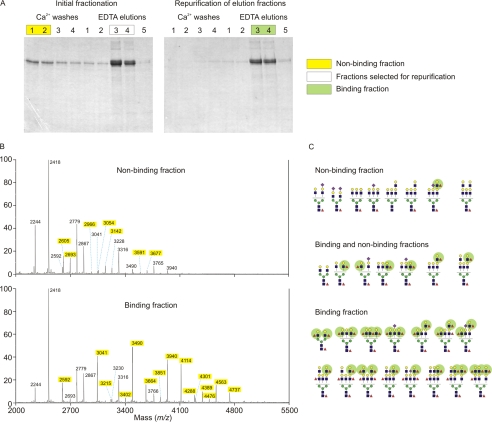
FIGURE 8.
Comparison of neutrophil lactoferrin samples with high and low affinity for SRCL. A, SDS-polyacrylamide gel analysis of neutrophil lactoferrin fractionated by two rounds of affinity chromatography on immobilized SRCL. Gels were stained with Coomassie Blue, and the indicated fractions were pooled for glycan analysis. B, mass spectrometry of glycans in binding and nonbinding fractions. Species unique to each pool are highlighted in yellow. C, summary of major glycans present in binding and nonbinding fractions, based on data in B and additional MS/MS results (data not shown), with Lewisx groups highlighted in green.

