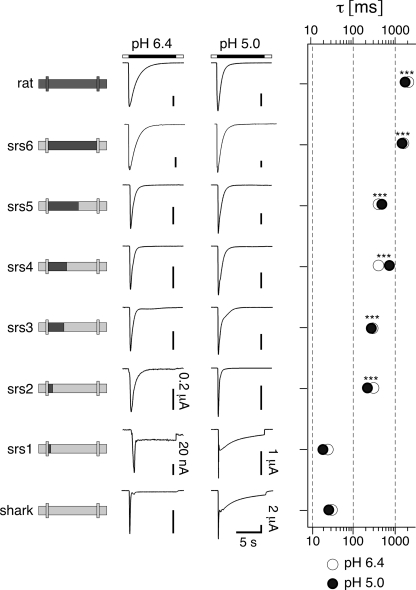
FIGURE 2.
A small region shortly after TMD1 determines sustained opening of sASIC1b. Left panel, schematic drawings of rASIC1a and sASIC1b and chimeras. Middle panel, representative traces of currents at pH 6.4 and 5.0. The scale bars correspond to 2 μA, except when otherwise indicated. Right panel, time constants of desensitization of the transient current at pH 6.4 (open circles) and 5 (filled circles). n > 6. ***, p < 0.001 (compared with sASIC1b).

