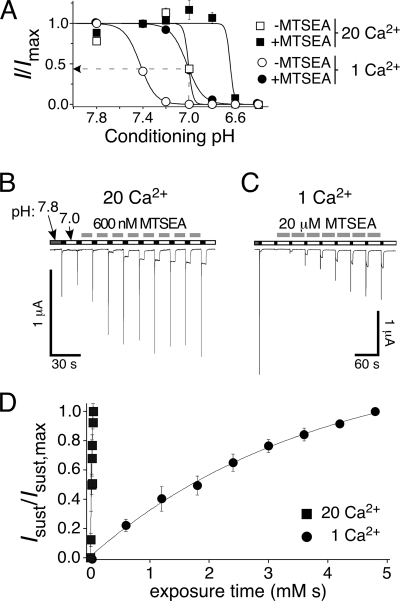
FIGURE 6.
MTS modification of sASIC1b-D110C is state-dependent. A, SSD curves for peak currents of sASIC1b-D110C in 1 mm Ca2+ (circles) and 20 mm Ca2+ (squares) before (open symbols) and after MTSEA modification (100 μm for 60 s at pH 7.4; filled symbols). The channels were activated with pH 5 with different conditioning pH levels, as indicated (n = 8). Peak current amplitudes were normalized to the peak current amplitude with conditioning pH 7.8 (1 mm Ca2+) or pH 7.4 (20 mm Ca2+), respectively. The dotted line illustrates the partial desensitization at pH 7 and in 20 mm Ca2+ (before MTS modification). B, 600 nm MTSEA was applied in 20 mm Ca2+ for 10 s in the interval between activation (pH 6, 5 s) of the channel. C, a higher concentration of MTSEA (20 μm) than in B was applied in 1 mm Ca2+ for 30 s in the interval between activation (pH 6, 5 s) of the channel. Note also the different time scales in B and C. D, increase in sustained currents as a function of exposure time (time exposed × concentration MTSEA) when MTSEA was applied in 20 mm Ca2+ (closed squares) or in 1 mm Ca2+ (closed circles) in experiments like those shown in B and C. For both Ca2+ concentrations, conditioning pH was 7.0. The symbols represent the mean amplitudes of the sustained currents (sust), normalized to the maximal sustained (sust,max) current and quantified every 30 s with 1 mm Ca2+ and every 10 s with 20 mm Ca2+ (n = 4); the lines represent exponential fits.

