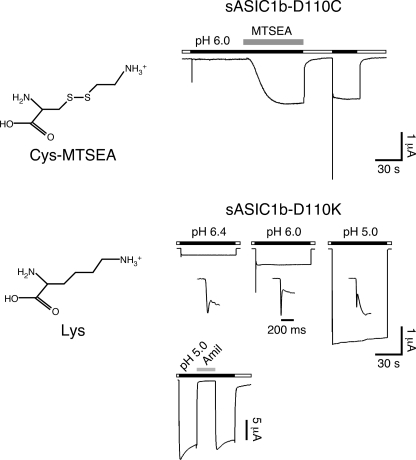
FIGURE 7.
A Lys at position 110 mimics MTSEA modification. Left panels, chemical structures of an MTSEA-modified cysteine and a lysine. Right panels, representative current traces for MTSEA modification of sASIC1b-D110C (top panel) and for sASIC1b-D110K (bottom panel). The currents for sASIC1b-D110K are shown at three different pH values. The current rise time is also shown on an expanded time scale. The current trace at the bottom illustrates amiloride sensitivity (1 mm) of the sustained sASIC1b-D110K current.

