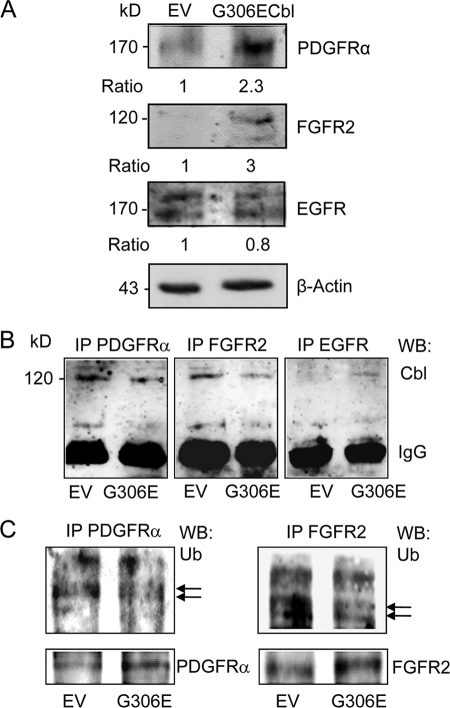
FIGURE 3.
Effects of the G3036E Cbl mutant on FGFR2, PDGFRα, and EGFR signaling. A, Western blot analysis showing that the G306E Cbl mutant increased PDGFRα and FGFR2, but not EGFR levels in clonal hMSCs. B, immunoprecipitation (IP) analysis showing decreased PDGFRα and FGFR2 associated with Cbl in clonal hMSCs expressing the G306E Cbl mutant. IgG served as internal control. WB, Western blotting. C, immunoprecipitation analysis showing decreased PDGFRα and FGFR2 associated with ubiquitin (Ub) in clonal hMSCs transduced with the G306E Cbl mutant. The same protein lysates showing increased PDGFRα and FGFR2 in G306E Cbl transduced cells were used as internal controls.

